
 DReS Robot Cell Simulator - Open a Robot Cell: Study (PSZ / XML), Library, Robot Archives (YouTube, English)
Requirements
- a dedicated graphics card with enough memory – large cells contain tens of thousands of parts (see GPU and limitations),
- the cell study (*.psz – a ZIP archive with the layout file StandaloneStudy_PsState.xml),
- the library of 3D components (JT files) referenced by the study,
- the robot archives (KRC folders with Folgen, UPs, $config.dat, $machine.dat) for programs, tools, bases and machine data.
First configuration
The paths are set once and stored in the settings of DReS:
| Menu | Meaning |
| Tools → Set Client System Root | root folder of the component library; the paths in the study are relative to it |
| Tools → Set Robots Archive Files | folder that contains the robot archive folders (named by the ExternalId of the robots in the study) |
| Tools → Set Robots Machine Data Files | folder with $machine.dat files when the robot models have no machine data next to them |
| Tools → Set Part Aggregator Size | buffer for very large scenes (see limitations) |
| Tools → Set Grid / Set Null Point Size / Set Robot Label | appearance of the helper objects in the 3D view |
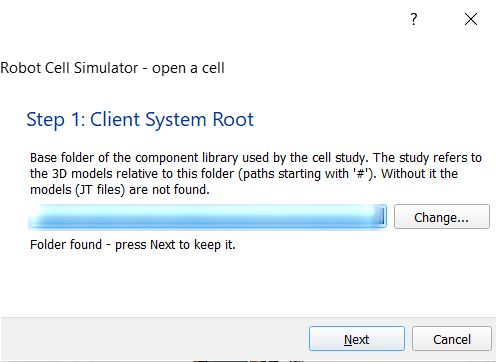
File → Wizard guides through the settings step by step: Step 1 Client System Root, Step 2 robot archives – each with a description and the current path (Next keeps it, Change... chooses another folder) – and Step 3 the cell file:
- Cell study (*.psz) – packed study, unpacked on every open,
- StandaloneStudy_PsState.xml – study already unpacked: faster, the same content,
- Session (*.rcsession) – see below,
- JT model (*.jt) – single 3D model without robots and programs.
The same descriptions are shown as file filters in File → Open.
Session file
File → Save session... writes a session file (*.rcsession, JSON) with the study file, the Client System Root, the robot archive folder, the tools and fixtures attached to the robots (with the mounting positions) and the parameters and checked programs of the work zones. File → Open session... (or Open with a session file) sets the paths, opens the study (window Available objects as usual) and then attaches the tools and checks the work zone programs; the console shows what was restored and which components were not found. Press Calculate in the Work Zones tab to calculate the zones again.
Opening a cell
File → Open accepts the *.psz archive (extracted automatically to a temporary folder) or the extracted StandaloneStudy_PsState.xml. A dialog lists all components of the study with a preview image (when available), the size of every JT file and the total size of the selection; the context menu selects or unselects groups and ranges. Only the selected components are loaded.
- Remember selected items – the selection is offered again the next time; Save / Open store a selection in an .ini file (e.g. one per robot group),
- Set robots and the linear unit to the position saved in the study – after loading, every robot gets the axis values A1–A6 (and E1 of its linear unit) saved in the study; programs and files are not changed,
- Use the component visibility of the study – loaded components are shown or hidden as in the study. The list decides what is loaded (memory, time), this option what is visible; hidden components can be shown in the Model Browser at any time.
- File → Insert file... adds another JT file or study to the open scene,
- File → New scene / Close scene releases all models, robots and paths (memory),
- File → Recent files reopens the last studies.
After loading, the robots are recognized automatically: the 7th axis (linear unit), the tools on the flanges and the robot archive with programs, tools ($config.dat) and machine data. The console reports every step (Opening finished after ...).
Main window
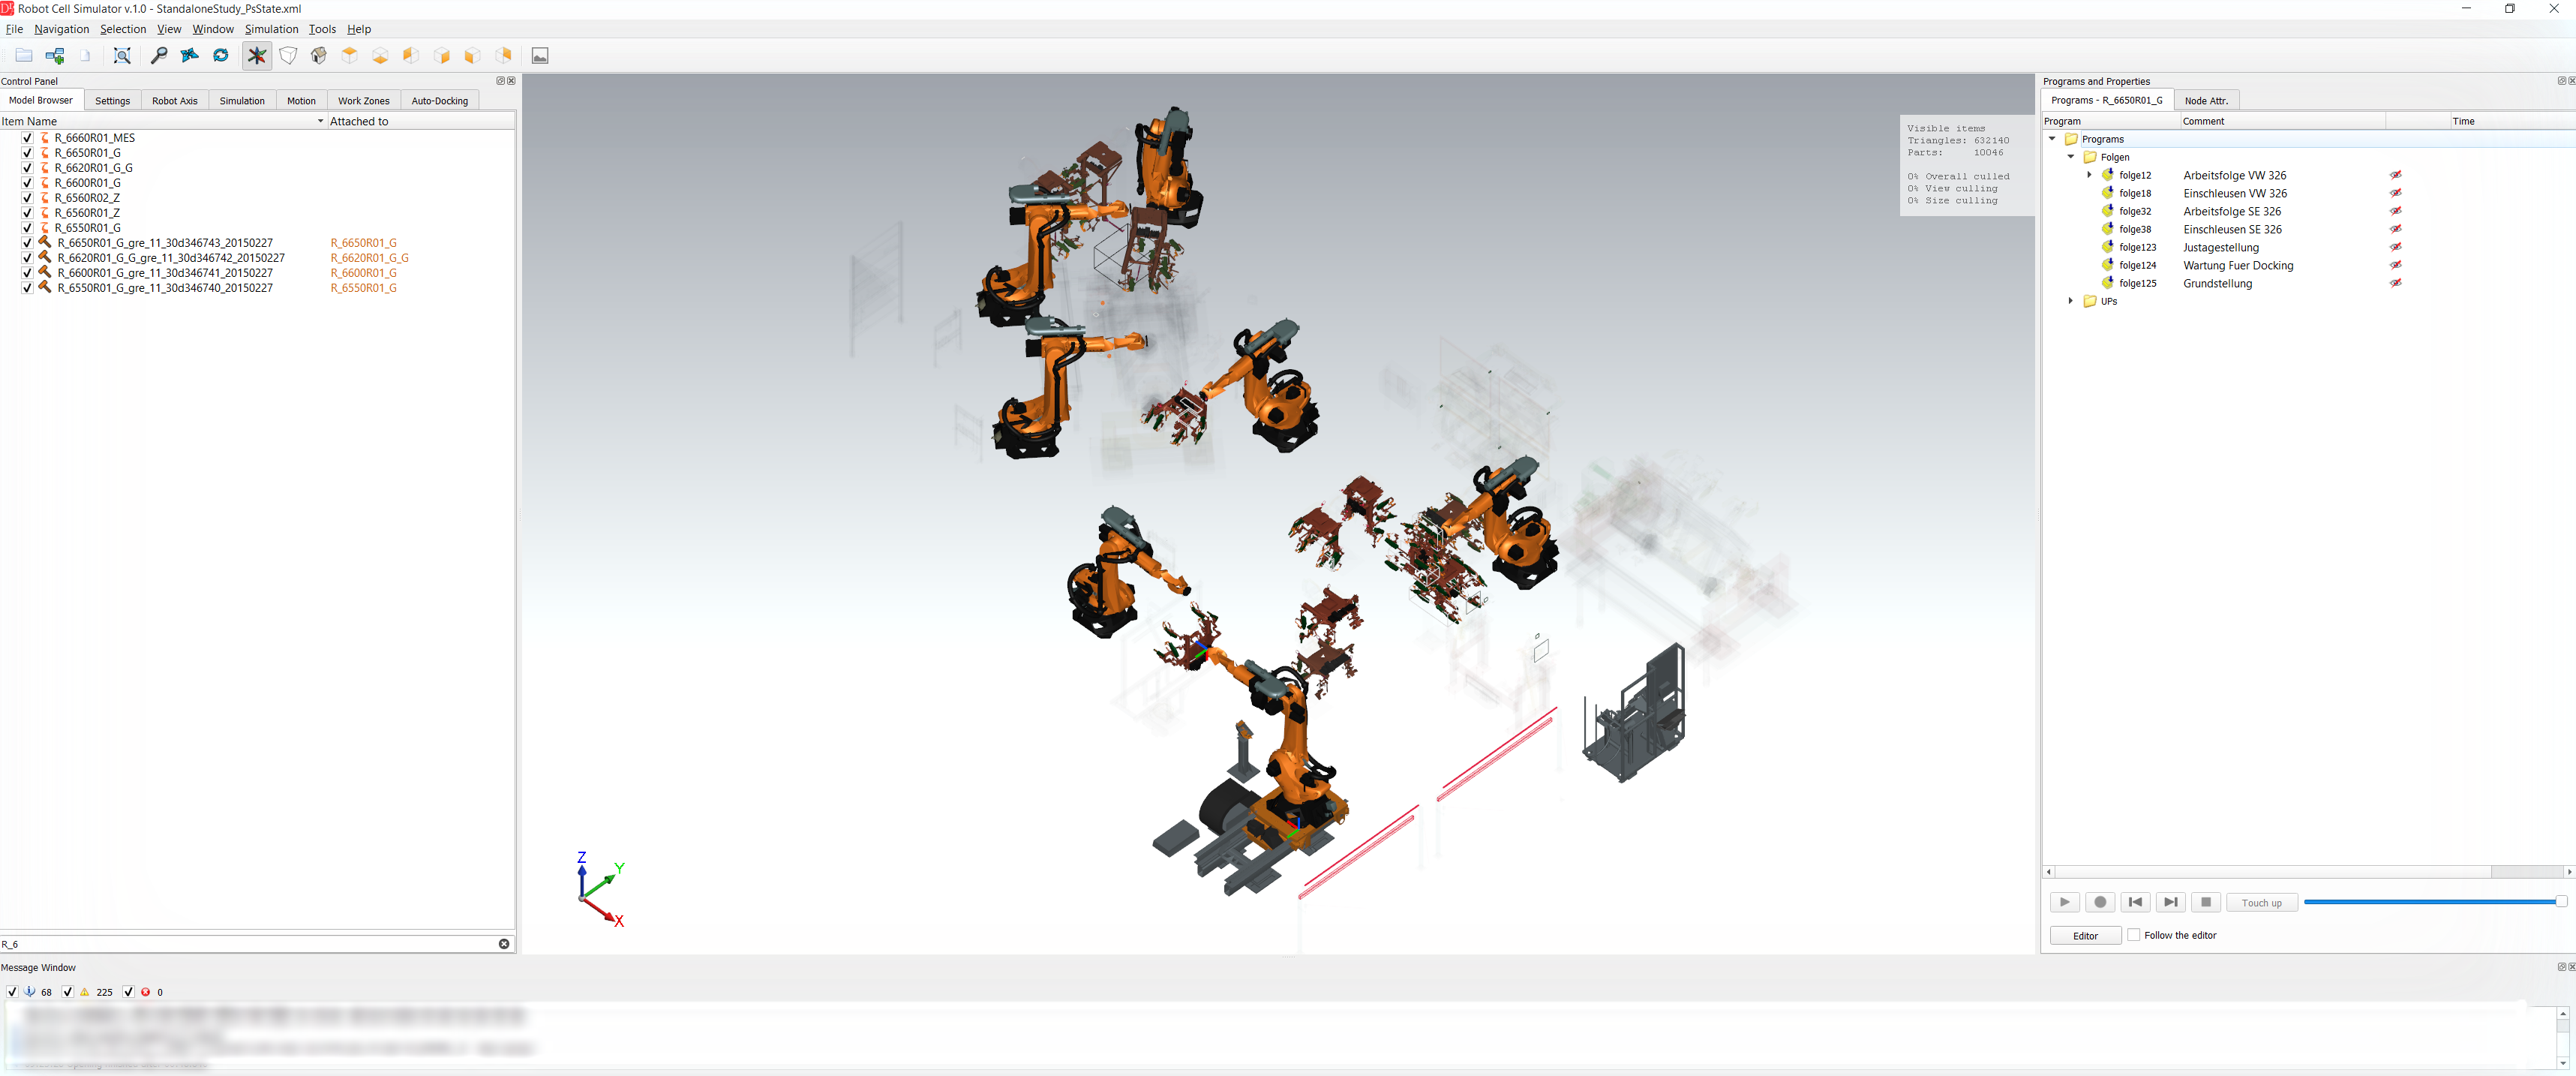
| Area | Content |
| Control Panel | tabs Model Browser, Settings, Robot Axis, Simulation, Motion, Work Zones, Auto-Docking |
| 3D view | the cell; the statistics in the upper right corner show visible triangles, parts and culling |
| Programs and Properties | programs of the selected robot (Folgen, UPs) with run controls; Node Attr. shows the attributes of the selected node |
| Message Window | information, warnings and errors of all functions, filterable by type |
All panels are dock windows – they can be moved, floated or hidden (Window menu).
Model Browser
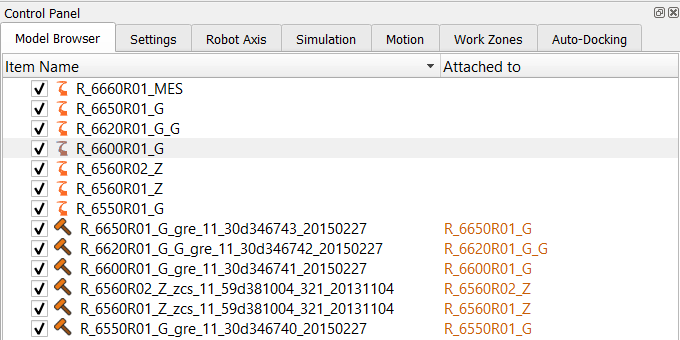 |
The tree contains all loaded components grouped by device type. The filter field at the bottom narrows the
tree (e.g. Clicking a robot makes it the current robot: the Robot Axis tab and the Programs panel switch to it. The context menu offers show / hide, View only, transparency, attaching and detaching tools and loading or saving the visibility of the items (Show checked items from file...), Remove from scene (until the study is opened again) and Keep robots and tools always on top. |
Message Window

The check boxes above the list filter the information, warning and error messages; the numbers show how many messages of each type were written. Most functions write a summary here (motion time, zones, tool changes). Save to file... in the context menu stores the messages – useful for the support.